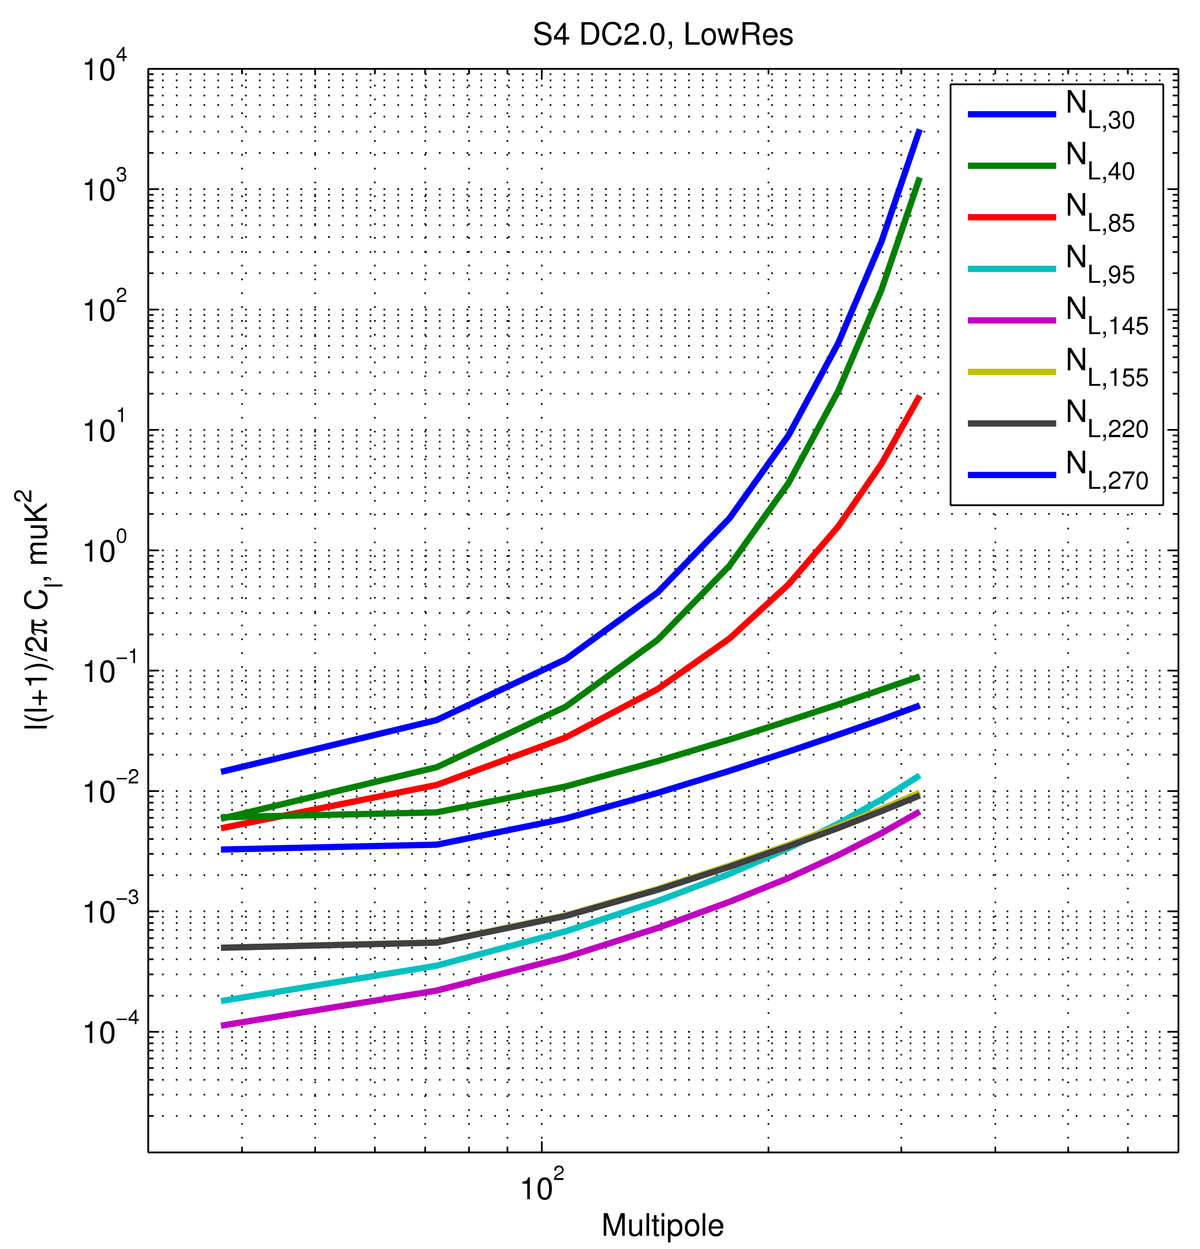
Left: \(N_{l}\)'s for the Degree Scale effort that
went into Data Challenges 2.0 and 3.0, amounting to ~575k actual
det-yrs on \(f_{sky}=0.03\), as recorded here
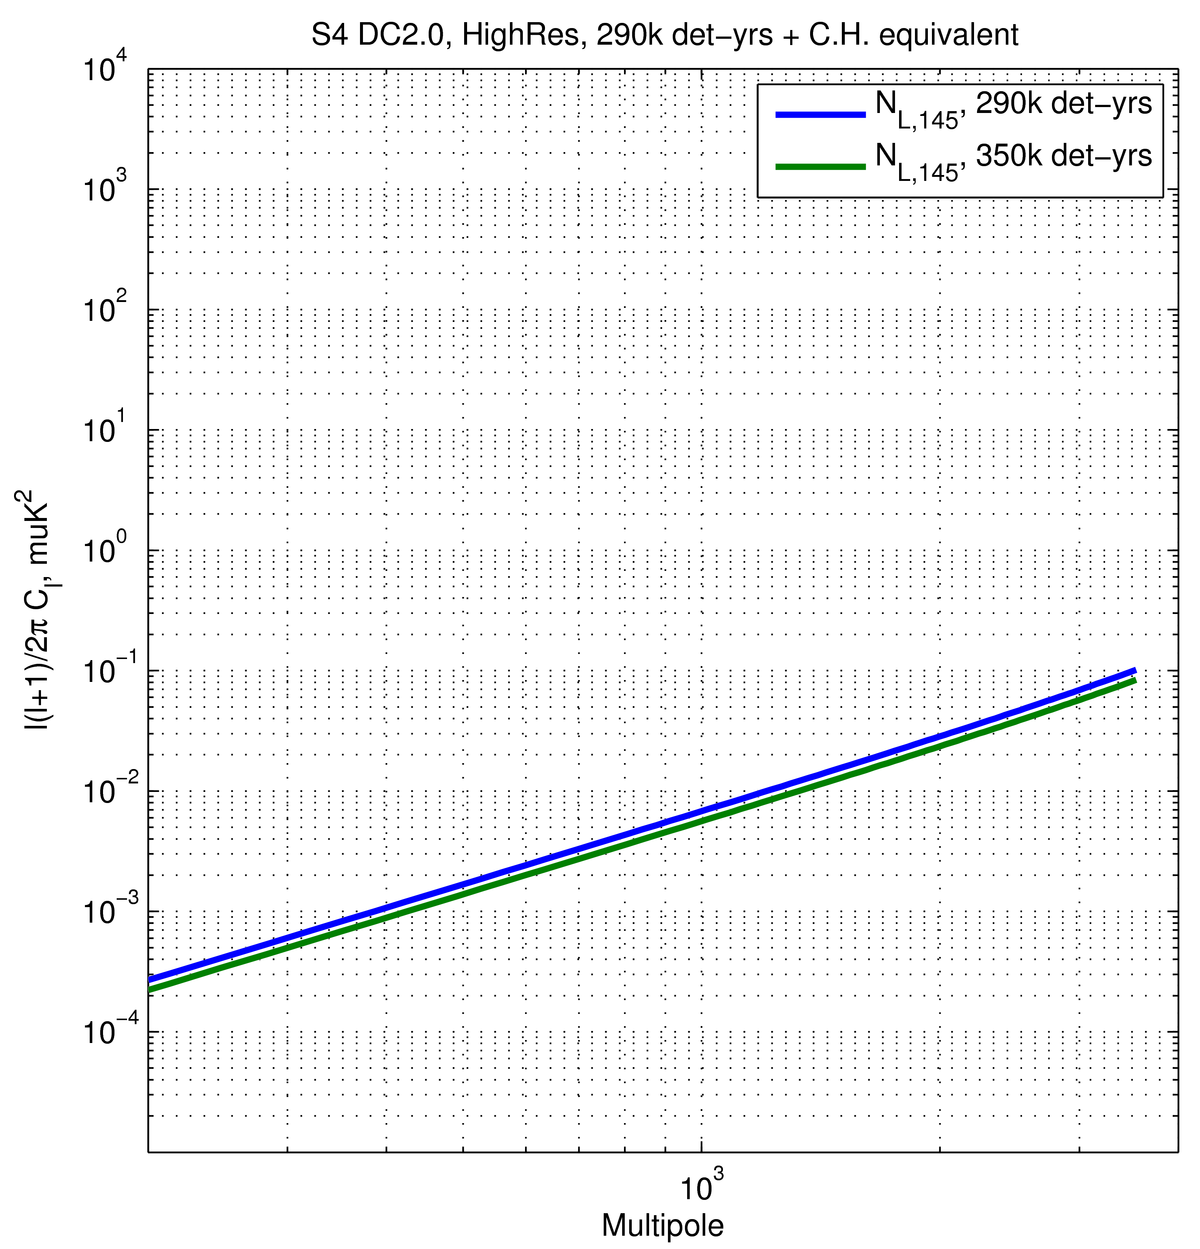
Middle: \(N_{l}\)'s for the Arminute Scale effort that
went into the optimization for DC2.0 and DC3.0 (though the data
challenges ultimately split this effort into three bands), amounting
to ~290k actual det-yrs (at 145 GHz) on \(f_{sky}=0.03\), as recorded here. The high-res
details are recorded under Table 1 in this posting.
In short: 1 arcmin beam,
\(l_{min}=300\) and \(l_{max}=4000\) for the Phi-reconstruction,
\(l_{min}=30\) for the complete E-mode map.
In addition, I also add a 350k det-yr case for comparison with the plot
to the right.
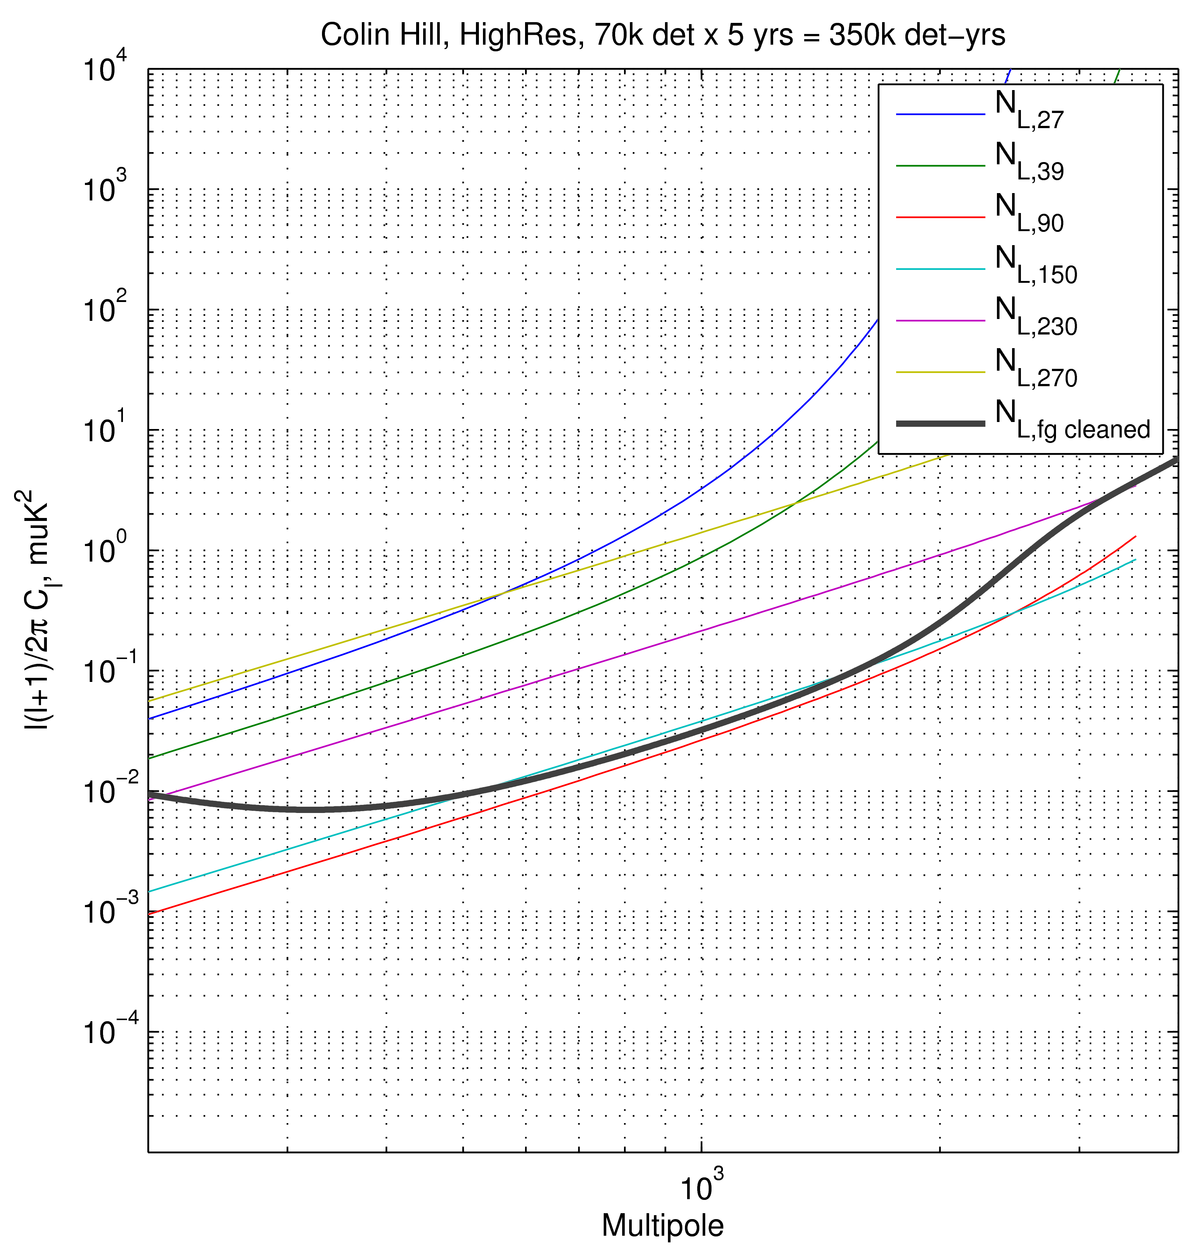
Right: Input white \(N_{l}\)'s and output foreground cleaned
\(N_{l}\) (assuming a fg cleaning method described in the posting
linked to the right) for 350k det-yrs on \(f_{sky}=0.03\), as recorded here.
At a glance conclusions: the ratio of the green \(N_l\) curve in the middle plot and the black curve in the right plot at \(l=1000\) is ~5, at \(l=2000\) is ~15, and at \(l=3000\) is ~30. Perhaps this is mostly due to the fact that C.H.'s ILC tries to completely zero out the fg contributions at high ell and therefore spends a lot of effort in trying to do so. We therefore expect that if one were to use Colin's fg cleaned \(N_l\) to obtain a delensing fraction, it will be quite a bit lower than the one assumed in the Science Book and data-challenges.