

This page contains data that correspond to the results presented in arXiv:0906.1181. If you have any questions about the usage of this data, please contact H. Cynthia Chiang (hsinc@princeton.edu).
2009 June 18 update: TB and EB are now included in the band power and newdat files. The old versions (2009 June 6) are still available here: band powers and newdat tarball.
This text file contains the BICEP TT, EE, BB, TE, TB, EB band powers and errors. The units are uK2.
This tarball contains the BICEP data in "newdat" format, as well as the band power window functions, and is intended for use in CosmoMC. The unpacked file contents are available here. The newdat file contains BICEP's TT, EE, BB, TE, TB, EB spectra; however, we have set the band selection flags so that only the EE and BB spectra are used. The beam error is turned off because CosmoMC does not pin the error at the angular scales that are used for absolute calibration, but this approximation is valid for BB. Per-bin band power uncertainties from beam error are available in the following file.
This file contains the band power uncertainties, Sb, from beam error.
These files contain the LCDM power spectra that are derived from WMAP 5-year parameters and used for data vs. model comparisons in the paper. These spectra are not fits to the BICEP data. The spectra are in units of uK2.
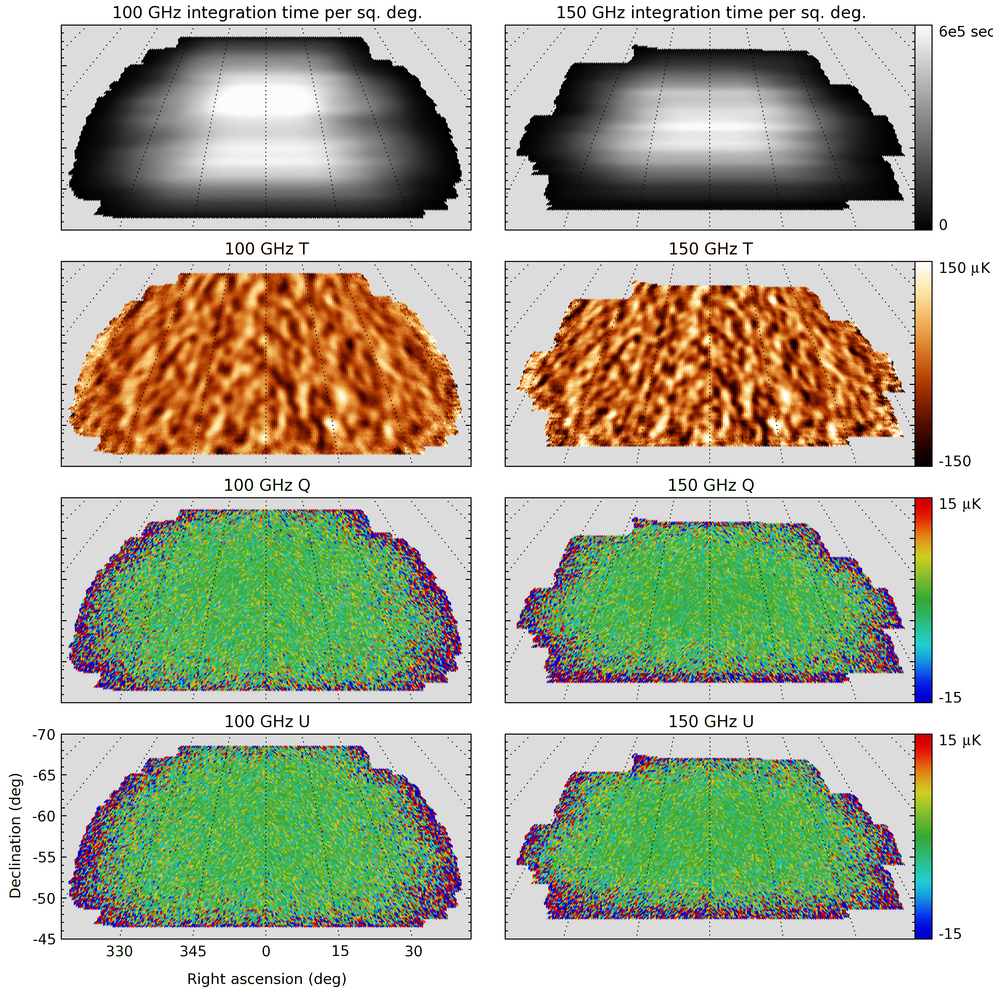
| T,Q,U maps | |
BICEP T, Q, U, and coverage maps. The resolution is about 0.9 deg and 0.6 deg at 100 and 150 GHz, respectively, and no smoothing or apodizing has been applied to the maps. The noise per square degree in the central region of the Q and U maps is 0.81 uK at 100 GHz and 0.64 uK at 150 GHz. Note that the color scales of the temperature and polarization maps differ by a factor of 10. |
| T,E,B maps | |
Data from BICEP's 100-GHz and 150-GHz channels are combined to form temperature, E, and B signal and jackknife maps. The E and B maps are apodized to downweight noise-dominated edge pixels. The temperature anisotropies are measured with high signal-to-noise, and the E signal map shows resolved degree-scale structure. The B signal map and the E and B jackknife maps are consistent with noise. |
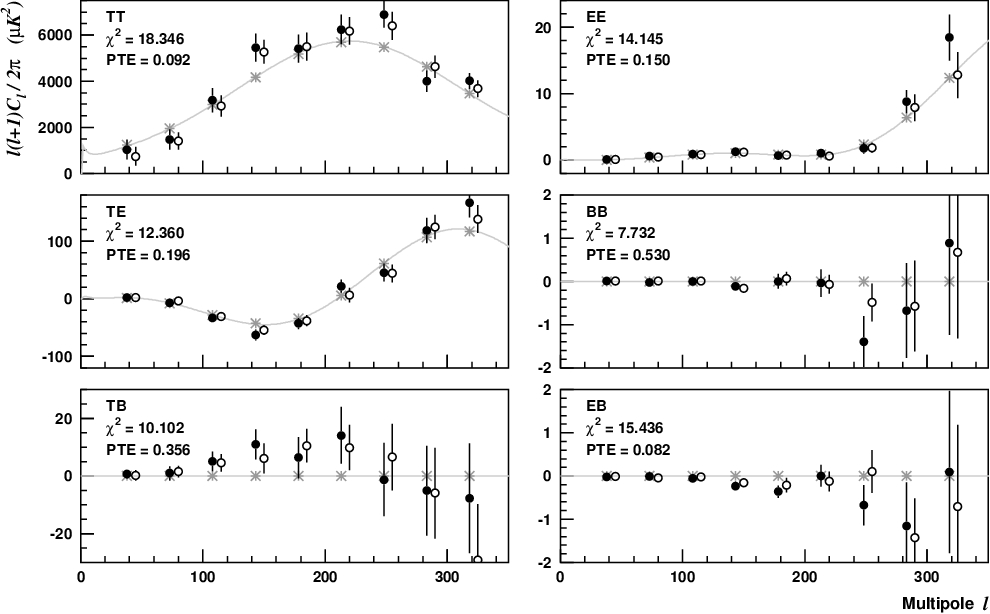
| Combined spectra | |
BICEP's combined power spectra (black points) are in excellent agreement with a LCDM model (gray lines) derived from WMAP five-year data. The chi2 (for nine degrees of freedom) and PTE values from a comparison of the data with the model are listed in the plots. The asterisks denote theoretical band power expectation values. Power spectrum results from the alternate analysis pipeline are shown by the open circles and are offset in ell for clarity. |
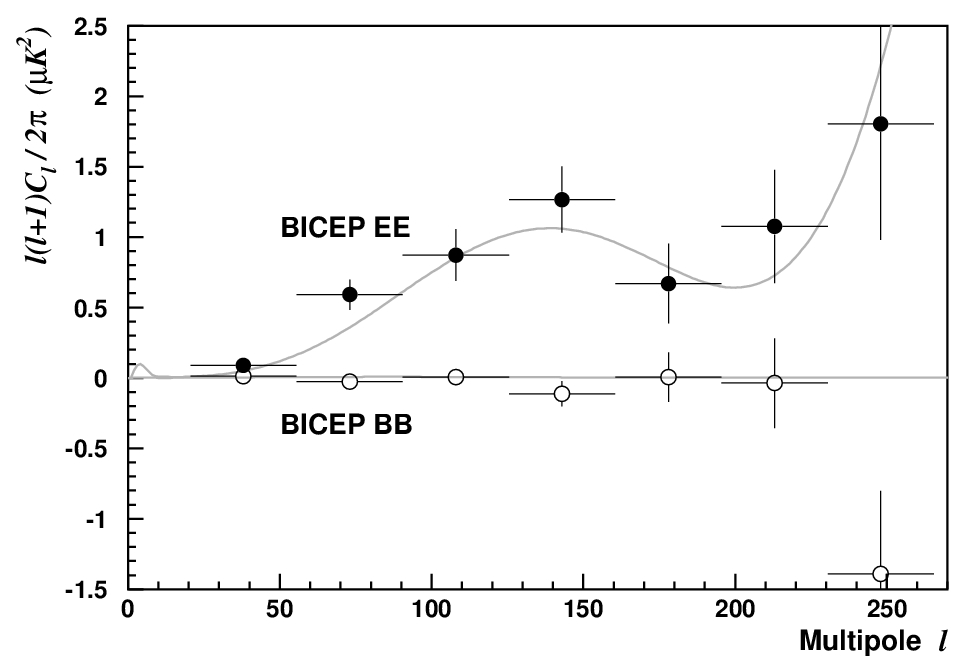
| EE and BB zoom | |
BICEP measures EE polarization (black points) with high signal-to-noise at degree angular scales. The BB spectrum (open circles) is overplotted and is consistent with zero. Theoretical LCDM spectra (with r = 0.1) are shown for comparison. |
| BICEP + other experiments | |
BICEP's TE, EE, and BB power spectra complement existing data from other CMB polarization experiments (Leitch et al. 2005; Montroy et al. 2006; Piacentini et al. 2006; Sievers et al. 2007; Wu et al. 2007; Bischoff et al. 2008; Nolta et al. 2009; Brown et al. 2009).) Theoretical spectra from a LCDM model with r = 0.1 are shown for comparison. For clarity, only EE band powers with >2 sigma significance are plotted. At degree angular scales, BICEP's constraints on BB are the most powerful to date. |
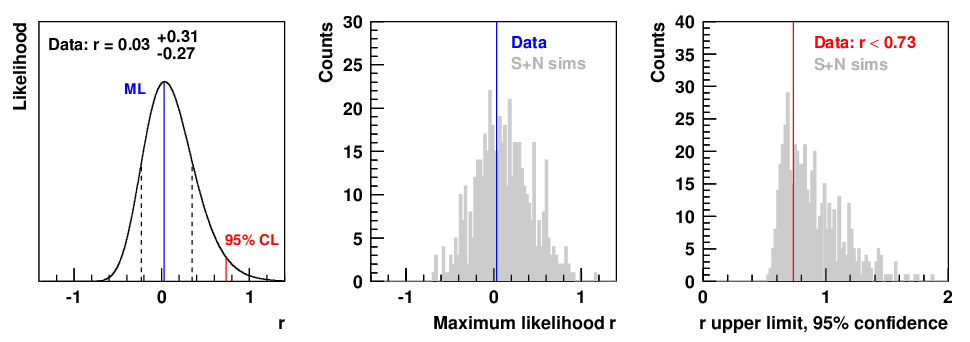
| Constraint on r from BB | |
The r likelihood function calculated from the BICEP BB spectrum is shown in the left panel and peaks at a value of r = 0.03. For comparison, a histogram of maximum likelihood r values derived from 500 signal-plus-noise simulations (with r = 0 input) is shown in the central panel. In the right panel, we derive 95% confidence upper limits on r from the both the simulated and real likelihoods. The data yield an upper limit of r < 0.73, which lies within the simulated distribution. |